
Crypto charts aren’t rocket science once you know what to look for. Start with candlestick charts to see price movements in detail. Pay attention to timeframes—daily or weekly charts show trends, not noise. Use technical indicators like RSI and MACD to spot overbought conditions. Support and resistance levels tell you where prices might bounce or break. Volume confirms whether trends are legitimate. On-chain metrics reveal what’s happening behind the scenes. The pros combine all these tools before making their moves.
Understanding the Basic Elements of Crypto Price Charts
Chaos. That’s what most people see when first looking at crypto charts. But there’s method to this madness if you know what you’re looking at.
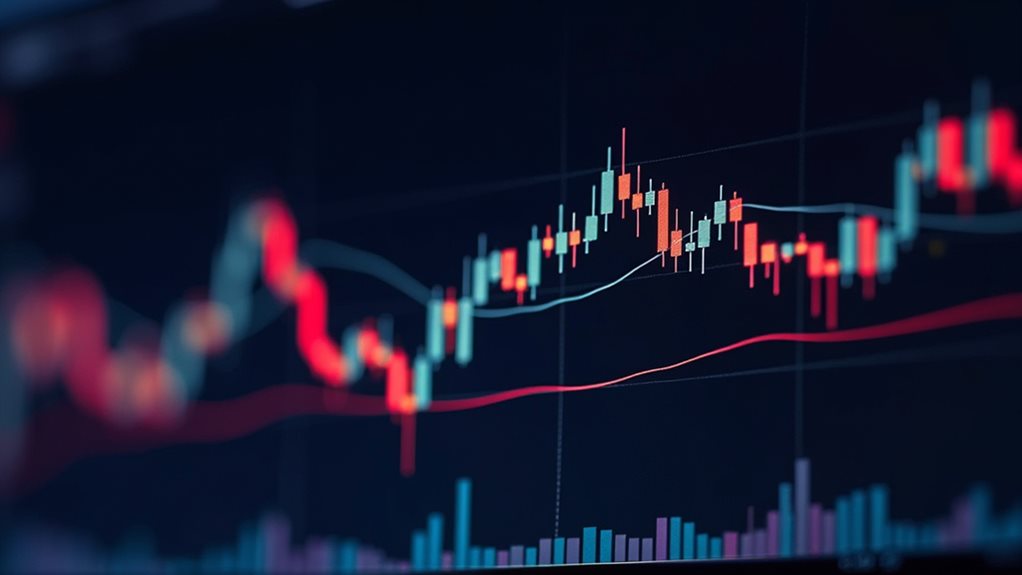
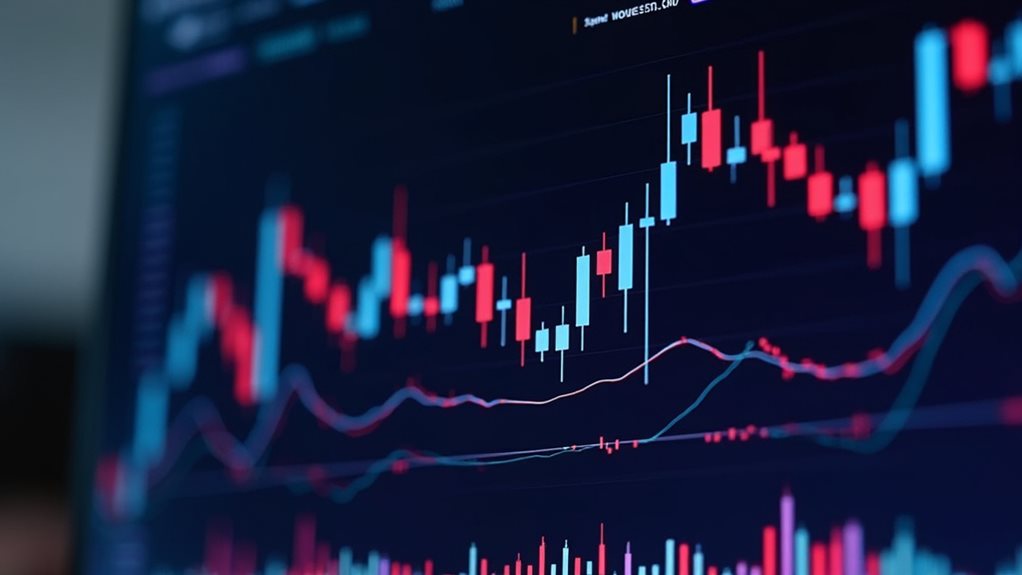
Price movements tell stories. Up, down, sideways—each creates a narrative about market sentiment. You’ll encounter two main chart types: line charts (simple) and candlestick charts (detailed). The candlesticks show you four prices in one stick. Pretty efficient, right? Unlike spot ETF tracking, which directly follows Bitcoin’s price, charts require more interpretation.
Time matters. A 1-minute chart shows noise; a weekly chart reveals the big picture.
BTC/USD or ETH/BTC—these pairs matter. They’re not interchangeable.
Linear or logarithmic scale? Linear for short-term, logarithmic for the long haul. Log scales don’t lie about percentage gains. And in crypto, percentages are everything. The log scale perspective allows you to see smaller price movements that would otherwise be invisible when viewing dramatic price changes over long periods.
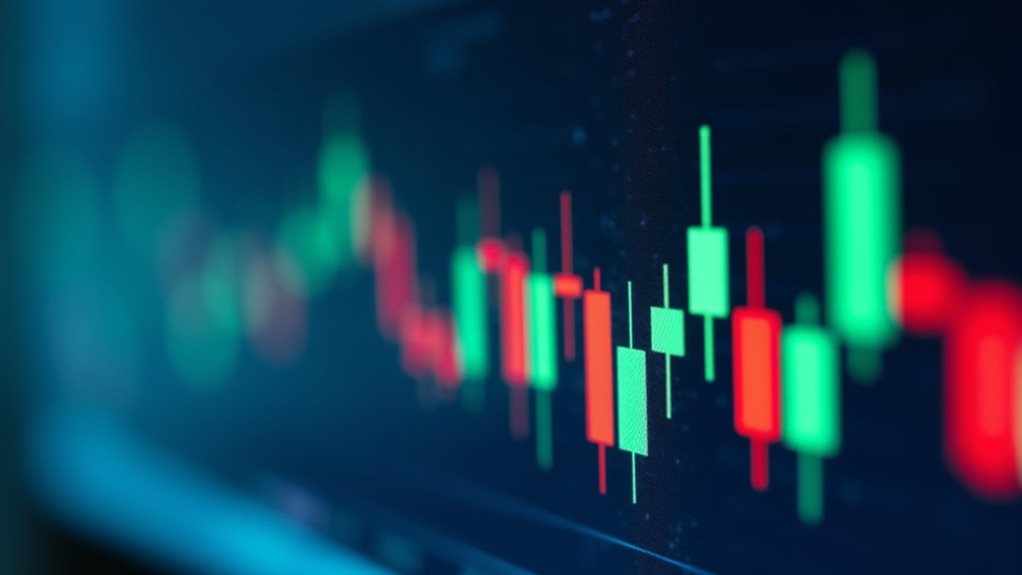
Green candles indicate price increases while red candles show decreases, providing visual market sentiment at a glance.
Essential Technical Indicators for Crypto Market Analysis
Five key indicators separate amateur traders from pros in the crypto world. You’ll need these tools to traverse the volatile crypto environment without getting rekt.
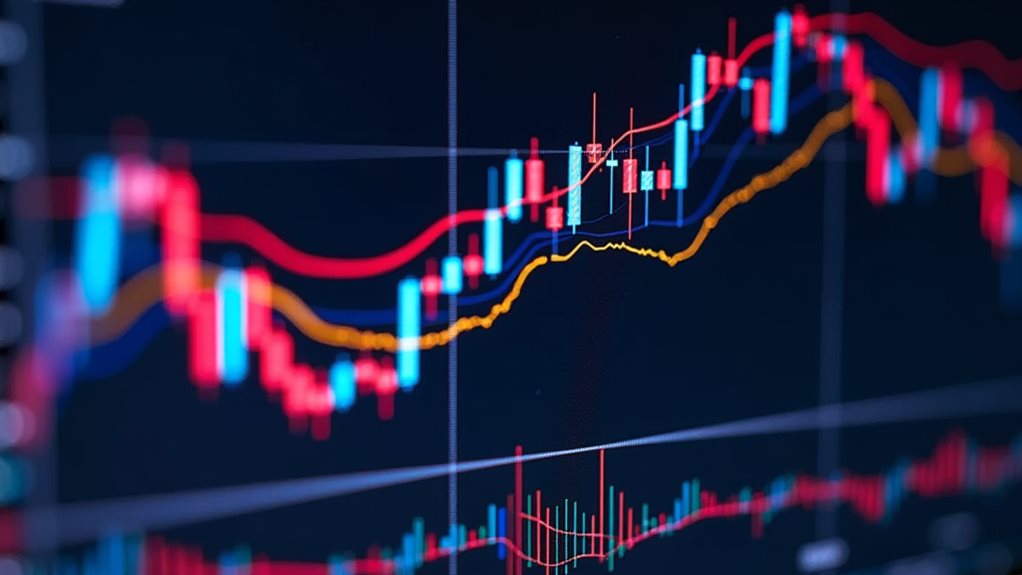
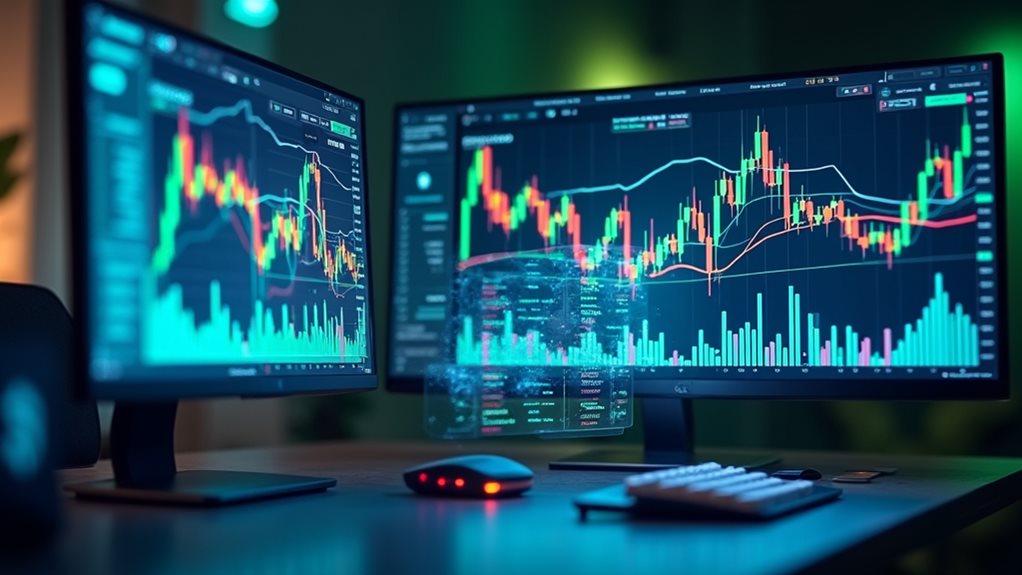
Moving averages flatten out price noise, helping you spot the real trend beneath market chaos. The relative strength index (RSI) shows when assets are overbought or oversold — essential for timing your moves.
- Moving averages (SMA and EMA) – Filter out market noise and reveal the underlying trend direction
- Bollinger Bands – Show volatility and potential price boundaries when crypto goes wild
- On-Balance Volume (OBV) – Confirms whether volume supports price moves (because price lies, volume doesn’t)
The Stochastic Oscillator compares the current price to its range over a specific period, making it effective for identifying potential trend shifts in crypto markets.
The MACD indicator helps traders identify momentum and trend direction by showing the relationship between two moving averages of an asset’s price.
Don’t overcomplicate things. These indicators aren’t magic — they’re probability tools.
Remember: in crypto, the trend is your friend until it suddenly isn’t.
Identifying Support and Resistance Levels in Digital Asset Markets
Beyond technical indicators, support and resistance levels form the backbone of any serious crypto trader’s analysis toolkit.
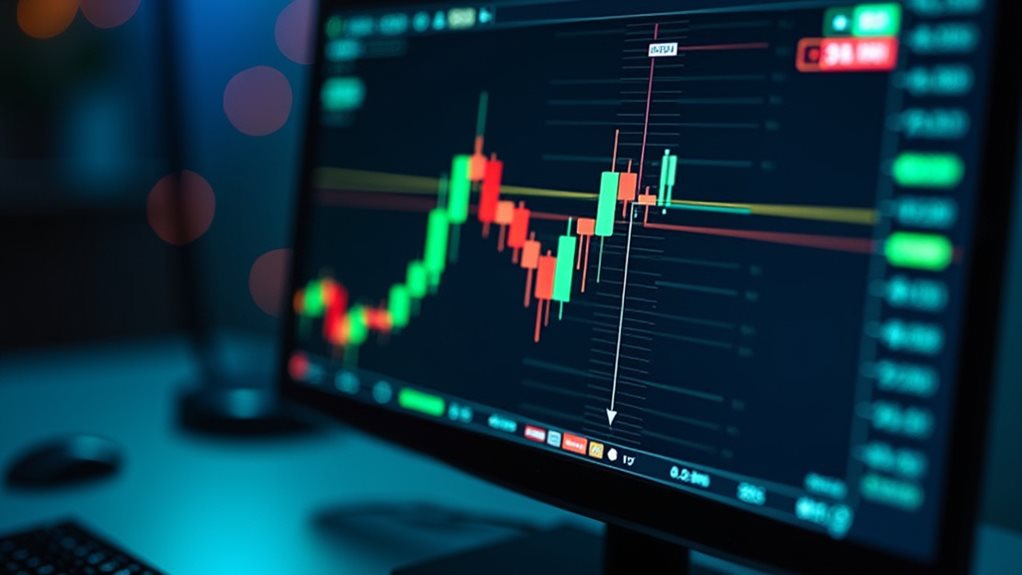
You’ll spot these horizontal lines where prices repeatedly bounce (support zone) or get rejected (resistance zone).
Market psychology drives these levels. At support, buyers jump in. At resistance, sellers take profits. Simple, right?
Look for at least three touches to confirm a level’s strength. When price action consolidates between these zones, something big is brewing—either a breakout strategy opportunity or potential trend reversal.
The cool thing? Broken resistance often becomes new support, and vice versa. Not magic—just traders being predictable.
During consolidation phases, smart money accumulates positions while amateurs get bored. In bull markets, you’ll notice these support and resistance zones typically trend upwards over time.
Risk management tip: these levels aren’t exact prices but zones where orders cluster. Don’t expect precision in crypto! With market volatility reaching new extremes in 2025, these zones become even more crucial for trading decisions.
Moving averages, especially the 50-day and 200-day, serve as dynamic support and resistance levels that adjust with price movement.
Recognizing Key Chart Patterns in Cryptocurrency Trading
Crypto charts tell stories—if you know how to read them. Double patterns like tops and bottoms aren’t just squiggly lines—they’re powerful signals of bearish reversal or potential bullish continuation.
Price consolidation phases often precede major moves. Volume confirmation is non-negotiable; without it, your pattern might be worthless. Successful traders understand that emerging patterns require careful validation before execution. Cup and handle patterns can provide excellent long entry opportunities when price breaks above resistance, signaling the completion of consolidation and potential continuation.
Look for these key formations:
- Head and Shoulders/Inverse – The classic reversal setup. Middle peak (or trough) stands taller (or deeper) than its siblings.
- Triangles and Rectangles – Consolidation patterns that signal continuation. Watch where price breaks out.
- Flags and Pennants – Short pauses in strong trends. Quick and dirty trend validation tools.
Remember this: patterns fail. A lot. That’s why smart traders wait for breakouts with volume before pulling the trigger.
Leveraging On-Chain Metrics to Confirm Market Trends
While chart patterns tell part of the crypto story, on-chain metrics reveal what’s happening under the hood.
Think of on-chain analytics as your X-ray vision into crypto markets – no BS, just data.
Active addresses don’t lie. When they surge, real users are engaging. Simple as that.
Transaction volumes and exchange flows? They show you whether whales are accumulating or dumping their bags.
Market sentiment isn’t just about what people say – it’s what they do.
Coin Days Destroyed and SOPR metrics expose whether holders are panicking or hodling strong. Those “diamond hands” aren’t so diamond when on-chain data shows massive profit-taking.
Watch miners closely. When they start moving coins to exchanges, they’re probably not feeling bullish.
Exchange reserves dropping? That’s supply leaving the market. Not rocket science, just smart observation.
The NVT Ratio helps determine if a cryptocurrency is overvalued by comparing its market cap to the economic activity it supports.
Understanding different transaction types is crucial when analyzing Ethereum versus Bitcoin, as they represent distinct forms of economic activity on their respective blockchains.
Combining Technical and Fundamental Analysis for Better Results

When you fixate solely on charts or fundamentals, you’re fighting with one arm tied behind your back. Serious crypto investors blend both approaches to capture the complete market picture.
Technical indicators reveal short-term entry points while fundamental analysis validates the asset’s long-term viability. It’s not rocket science—it’s just smart investing. With proper security measures in place, investors can focus on analysis rather than worrying about asset protection.
- Use fundamental analysis to filter out weak projects first—examine tokenomics, team credibility, and adoption metrics before even touching a chart.
- Apply technical indicators like RSI and MACD to time your entries on fundamentally strong assets.
- Set stop-losses based on technical support levels while maintaining conviction from your fundamental research.
Volume confirms technical signals. Momentum indicators prevent FOMO purchases. This integrated strategy appeals to both value investors and traders who recognize that market wisdom comes from multiple perspectives. The altFINS platform excels at providing comprehensive analytics for both technical and fundamental approaches. Together, they’re your early warning system against both short-term volatility and long-term project failure. Powerful stuff.
Practical Strategies for Trading Based on Chart Signals
Most crypto traders lose money. Why? They jump in without clear entry strategies or panic-sell without planned exit strategies. Sounds familiar?
Start by defining rules before touching that “buy” button. When that Inverse Head and Shoulders pattern forms (84% success rate!), wait for the breakout confirmation. Don’t be greedy.
Place stop-losses just outside pattern boundaries. Your future self will thank you when that “sure thing” goes south.
For exits, use the pattern itself as guidance. Flag patterns? Measure the “flagpole” to set targets. Or try trailing stops to lock in profits while letting winners run. Consider using Fibonacci retracement levels as potential exit targets during price pullbacks.
Remember that different crypto chart patterns fall into three distinct categories that signal continuation, reversal, or indecision in the market.
Combine with technical indicators like RSI and MACD. They’re not magic, but they help.
And for God’s sake, avoid trading during major news events. That’s amateur hour.
Frequently Asked Questions
How Do I Differentiate Between Market Manipulation and Genuine Price Movements?
You can distinguish manipulation from genuine price action by analyzing market psychology, looking for abnormal volume spikes, price movements unrelated to news, and identifying unusual trading patterns from a limited number of addresses.
What Timeframes Work Best for Different Crypto Trading Strategies?
For short term strategies, use 1-15 minute charts when scalping or day trading. Choose 1-4 hour timeframes for swing trading. Daily and weekly charts work best for your long term investments and position trading.
How Much Capital Should Beginners Risk on Technical Analysis-Based Trades?
You should risk only 1-2% of your total capital per technical analysis trade. This risk management approach protects your funds while you’re learning beginner strategies and developing consistent trading skills.
Can Technical Analysis Predict Black Swan Events in Crypto Markets?
No, you can’t rely on technical analysis to predict black swan events in crypto. These rare, unpredictable shocks happen outside normal market patterns, making event prediction impossible through chart analysis alone.
How Do Halvings and Token Burns Affect Technical Indicator Reliability?
Halvings and burns create supply shocks that distort technical indicators. You’ll find traditional signals less reliable as halving effects alter price patterns and burn mechanics interrupt normal distribution models your indicators depend on.